My Slack Bot Got Slow: How I Made It Fast Again
Originally posted on Medium
Nestor is a programmable Slack Bot that supercharges your team. Nestor comes with a bunch of super powers that enable your team to get productive immediately (so Heroku, Mixpanel, CircleCI, Github, Papertrail, Librato and more) without any installing 20 different bots!
With close to 2,000 teams using Nestor, performance started to degrade and in this piece, we will go through how we tracked down the problem and fixed it.
The Slow Down
The tell-tale signs were all too familiar: The dreaded R14 “Memory Quota Exceeded Errors” from Heroku. The Heroku platform deals with “Memory Quota Exceeded” errors by using disk swap which severely slows down your application.
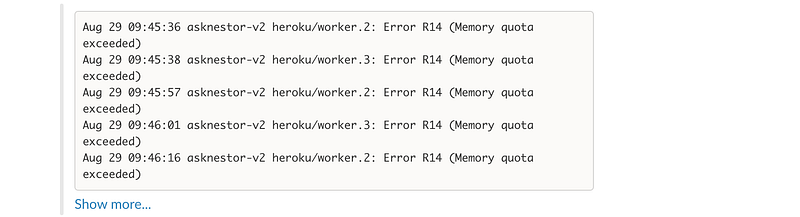
Sidenote: Setup notifications for Platform Errors and pipe them to Slack (using Papertrail), so that you’re always on top of things.
The Memory-Quota Exceeded notifications would occur every few hours (until I restarted the Nestor web app) and constantly restarting your application is not a good long-term strategy (whatever DHH might say).
The Investigation Begins
There were a few simple ways to start the investigation:
New Relic Is Your Friend
In the “Transactions” section on New Relic, you can find out which are the most time-consuming transactions on your app and by a long-shot, the most time-consuming transaction on Nestor belong to ImportUsersForTeamJob.

A few portions of Nestor’s code is open-source so luckily we have some context on what that is.
ImportUsersForTeamJob is called whenever a new team signs up to use your bot, and whenever a new member is added to the Slack team and your team’s directory needs to be refreshed.
ImportUsersForTeamJob calls Team#import_users! which calls the users.list Slack API to get the team directory, parses the JSON and makes/updates entries in the Nestor database.
Run-Time Metrics on Heroku
Great, so long execution times is one thing and since this was running asynchronously in a Sidekiq job, it wasn’t really affecting performance. The next step in the investigation was to figure out if this was affecting memory usage.
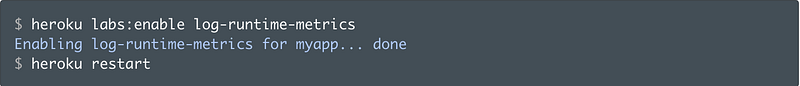
Luckily, Heroku has a way for you to monitor this with its “log-runtime-metrics” Labs feature that periodically outputs the memory used by your dyno (along with other information such as CPU, load average and so on).
What I found out was that there was definitely a memory leak happening whenever ImportUsersForTeamJob completed execution (memory used by the dyno would steadily increase over time).

More Logging
Upon adding more log statements in the Team#import_users! method I found out that there were very large teams (1000+ members) that were adding new members every few hours. Every time the method finished running, a memory leak was happening. The imports for the really large teams was also causing the large amount of the “slow transactions” on New Relic.
But why was this happening?
Identifying The Problem
I had a few theories as to why importing large team directories might be causing a leak — our HTTP client was downloading a really large JSON payload from the Slack API and the client library might have a leak? Maybe the JSON library has a bug that causes a leak to happen when it’s parsing really large strings. Since we were holding references to the parsed hash for a long time, that was causing a leak to happen?
One major red problem was that we were synchronously downloading a large payload from an API and parsing it synchronously as well.
Deploying The Solution
Instead of doing things synchronously, we can solve this problem by streaming the response from the Slack API, and use a streaming JSON parser to parse the HTTP response on the fly and make sure we assemble our team directory that way. The resulting code is here:
The first step was to modify our Slack Client to yield chunks of data to the caller rather than parse the entire response:
and Step 2 was to modify the import_users! method on Team to make sure it parses streams of JSON rather than the entire response body:
The Result
Once we deployed this solution, we found that from log-runtime-metrics plugin, that memory leaks weren’t happening any more even after very large teams were onboarded or updated and the platform error notifications stopped as well.
Performance went up, queues weren’t clogged any more and Nestor was back to doing what it does best — serving your Slack team in a jiffy!
Want A Simpler Way To Run Your Slack Bot?
If you want to run your Slack Bot in peace without worrying about scaling and performance problems, check out Botmetrics — a way for you to run your Slack Bot and get rich metrics about your bot.